
Building blocs
As global carbon pricing grows and becomes more fragmented, regional carbon markets offer a solution

Welcome to Carbon Risk — helping investors navigate 'The Currency of Decarbonisation'! 🏭
If you haven’t already subscribed please click on the link below. By subscribing you’ll join more than 5,000 people who already read Carbon Risk. Check out the Carbon Risk backstory and find out what other subscribers are saying.
You can also follow on LinkedIn, Bluesky, and Notes. The Carbon Risk referral program means you get rewarded for sharing the articles. Once you’ve read this article be sure to check out the table of contents [Start here].
Thanks for reading Carbon Risk and sharing my work! 🔥
Estimated reading time ~ 9 mins
Launched 20 years ago, the EU emissions trading system is the worlds most advanced compliance carbon market. As so often happens, regulation first introduced in the European Union tends to influence global standards and policies - known as ‘the Brussels effect’. The EU ETS is one of the most successful examples of that phenomenon in action.
The latest World Bank State and Trends of Carbon Pricing report reveals an increasing share of global GHG emissions are now subject to direct carbon pricing. That’s good news — carbon pricing enables scarce resources to be allocated more efficiently, reducing the cost of cutting emissions (see It's the carbon price, stupid!)
The issue now is that carbon pricing is becoming ever more fragmented, and that poses a problem as countries seek to prevent competitors, who might not have a comparable carbon price, from undercutting them.1
Here’s some of the key facts from the World Bank report.
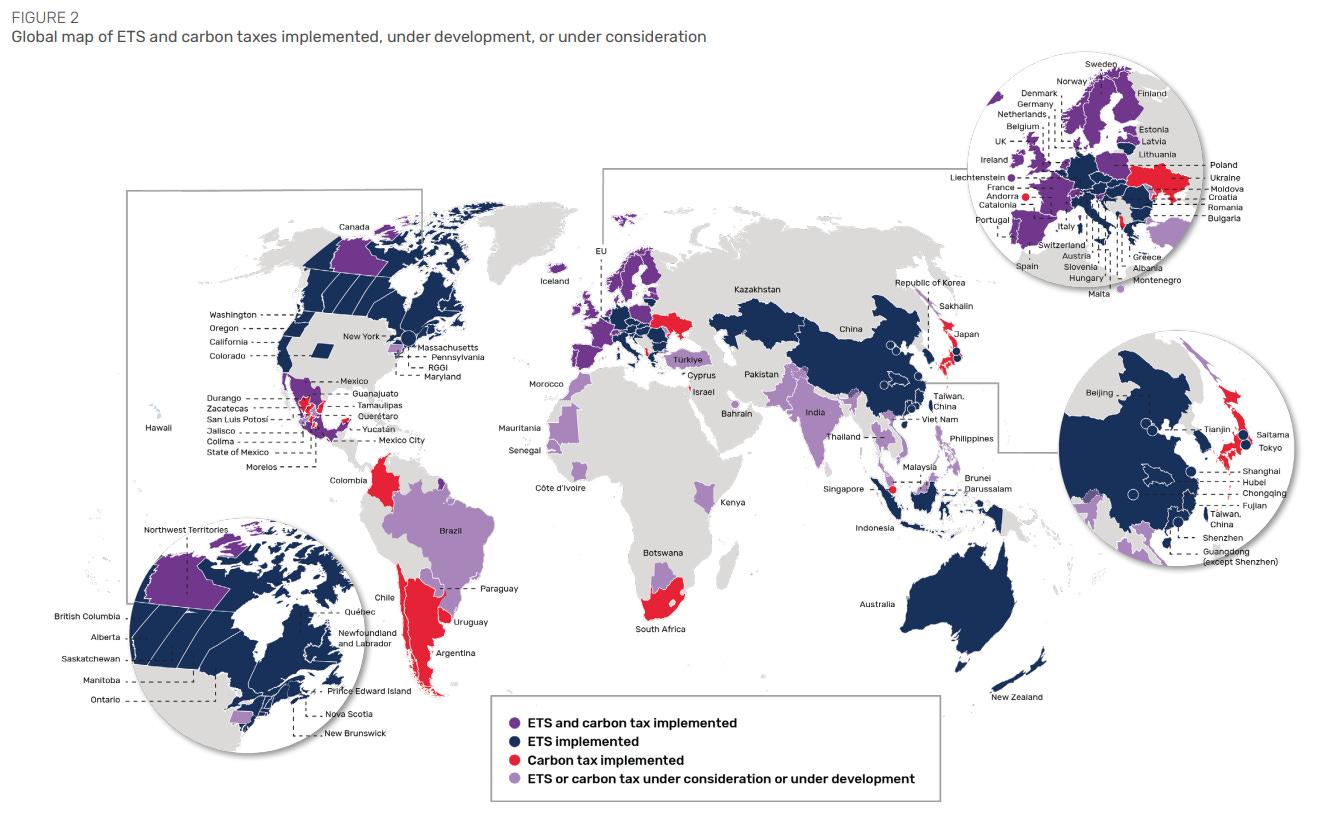
Direct carbon pricing covers approximately 28% of global GHG emissions, up from 24% in 2024. There are now 80 direct carbon pricing instruments in operation around the world; 37 emissions trading systems and 43 carbon taxes.
Two sectors have the highest level of direct carbon pricing coverage: the power sector (51% of emissions covered) and industry (43%). Most other sectors languish at around 5-15%, with waste, agriculture, and land-use, land-use change, and forestry (LULUCF) at or near zero.
Rate-based ETSs (also known as intensity-based ETS) are becoming increasingly popular due to the low cost and the flexibility they give obligated emitters. This type of approach is used in Australia, China, Indonesia, and several provinces in Canada. Other jurisdictions such as Turkey are considering introducing a rate-based ETS.2
Almost two-thirds of ETSs and almost one-fifth of carbon taxes allow eligible carbon credits as a compliance option according to the World Bank. While most instruments limit carbon credits to ~5% of compliance, others such as Australia’s Safeguard Mechanism and Vietnam’s proposed ETS allow much higher levels, of up to 30% (see Everything you need to know about Australian Carbon Credit Units (ACCUs)).
The global average price for carbon pricing instruments was $19 per tonne CO2 in 2025, a doubling in real terms since 2015. However, given that over 70% of global GHG emissions are without a direct carbon price, the global emissions-weighted average carbon price is a mere $5 per tonne CO2.
The report also shines a light on the disparity in implied carbon pricing; the fuel excise duties, fossil fuel subsidies, and other incentives that alter consumption behaviour. The World Bank focus on Latin America to make their point. The total carbon price in 2024 had strengthened to $37.50 per tonne CO2, as governments in the region introduced fiscal reform. In contrast, over the past five years direct carbon pricing only accounts for 13% of the total carbon price (see A uniform global carbon price is unworkable, and unnecessary).
As I remarked at the beginning of this article, it’s encouraging news, but there’s very little in the way of a standard template being applied from one country to another. A recent report by Oxford Economics suggests that the fragmented nature of global carbon pricing instruments increases the risk of carbon leakage.3
The average global carbon leakage rate is estimated to be between 5% and 30%, with small open economies typically more exposed to the phenomenon than larger ones. Emissions-intensive trade-exposed (EITE) industries such as chemicals, cement, steel, and aluminium face high carbon leakage rates of between 47% and 55% if high income countries introduce a carbon price consistent with their nationally determined contributions (NDCs). In comparison, localised industries such as aggregates face much lower carbon leakage rates (12%).4
The other Brussels effect
Carbon border levies such as Europe’s Carbon Border Adjustment Mechanism (CBAM) seek to mitigate the risk of carbon leakage, ensuring that direct carbon pricing isn’t undermined. Indeed, one of the key motivating factors for countries seeking to introduce a carbon price recently has been to reduce their exposure to the CBAMs emerging in Europe and elsewhere.