Welcome to Carbon Risk — helping investors navigate 'The Currency of Decarbonisation'! 🏭
If you haven’t already subscribed please click on the link below, or try a 7-day free trial giving you full access. By subscribing you’ll join more than 3,000 people who already read Carbon Risk. Check out what other subscribers are saying.
You can also follow my posts on LinkedIn. The Carbon Risk referral program means you get rewarded for sharing the articles. Once you’ve read this article be sure to check out the table of contents.
Thanks for reading Carbon Risk and sharing my work! 🔥
Estimated reading time ~ 12 mins
“we need broader and more ambitious carbon-pricing mechanisms worldwide. The price mechanism exists in order to allocate scarce resources, and in this case the scarce resource is the limited amount left in the atmosphere for further concentrations of GHGs. This, in fact, is the ultimate scarce resource, and it needs to be priced accordingly.”
- Mark Lewis, Andurand Capital Management1
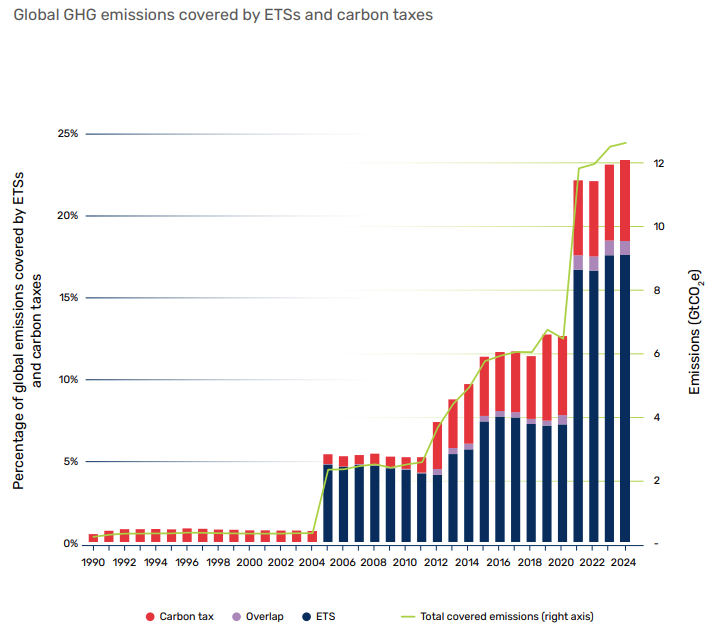
Almost one-quarter (24%) of global carbon emissions are covered by ETS’s or carbon taxes, according to the latest estimates from the World Bank. Approximately 18% of emissions are covered by an ETS, carbon taxes cover 5.5%, while 0.5% is covered by both an ETS and carbon taxes.2
Although the total share of global emissions covered by carbon pricing is broadly unchanged relative to one year ago, the stable picture masks some important trends that are happening beneath the surface.
First, when a new ETS or carbon tax is introduced it increases the share of global emissions covered by carbon pricing. In total there are 75 ETS’s and carbon taxes currently in operation, a net gain of two over the past twelve months. One of the main additions identified by the World Bank is Australia’s reformed Safeguard Mechanism which has been transformed into an intensity-based ETS (see Everything you need to know about Australian Carbon Credit Units (ACCUs)).
Second, remember that carbon pricing, and ETS’s in particular are designed to achieve a reduction in emissions. In the case of a cap-and-trade scheme such as the EU ETS, the linear reduction factor (LRF) details the rate at which the emissions cap is reduced year-on-year. For example, emissions covered by the EU ETS are estimated to have declined by 15.5% between 2022 and 2023, much faster than the 2.2% LRF in operation at the time. The decline in emissions inevitably means a lower percentage of the global economy is covered by carbon pricing.
Growth in carbon price coverage unlikely to hit targets
One of the most important strategies to be announced at COP26 in 2021 was the Global Carbon Pricing Challenge (GCPC). The challenge laid down by the Canadian Government was to expand carbon pricing across the global economy, with a goal of covering 60% of GHG emissions by 2030. The larger the percentage of global emissions covered by carbon pricing, the more efficient the allocation of scarce resources is likely to be, and the lower the carbon price will need to hit to achieve the required emission reductions.3
Unfortunately the World Bank thinks that carbon pricing is unlikely to rise above 30% of global emissions in the near future. The World Bank estimates that if those ETS’s under development in the large economies of Brazil, India, and Turkey were to launch then they could account for 3% of global emissions. However, the share of emissions covered by these plus those of other smaller economies could account for almost 10% at the maximum (see No Turkish delight: Cheap Russian coal, macroeconomic disarray, and the EU's carbon border levy).
In contrast to the trend historically whereby individual jurisdictions have implemented carbon pricing, the next 3-5 years could be dominated by commodity and sector specific carbon pricing. For example, the EU’s CBAM introduces a carbon price on the embedded emissions of certain carbon intensive products (iron and steel, aluminium, hydrogen, fertiliser, cement, and electricity) imported into the EU. The World Bank estimates that this represents between 0.15% and 0.6% of global emissions based on the current scope of the EU CBAM.
Other forms of carbon pricing target specific global industries. For example, CORSIA applies to international aviation and requires airlines who emit more than their baseline level of emissions to purchase CORSIA eligible carbon credits. Another example highlighted by the World Bank is the global carbon tax on maritime being considered by the International Maritime Organisation (IMO). Both schemes are currently scheduled to enter into force (i.e., mandated) in 2027. The two schemes are thought likely to cover 1.5% of global emissions (see here and here for the background).
The report doesn’t seem to consider the potential expansion in the Chinese ETS and the impact that could have on the share of global emissions. China’s ETS currently only covers the power generation sector, including some 2,200 utilities, responsible for 4.5 billion tonnes of GHG per year, or 40% of Chinese emissions (~13% of global emissions).
Seven other carbon intensive industries (petrochemicals, chemicals, building materials, iron and steel, nonferrous metals, paper, and aviation), are expected to be included over the next few years. If all of these industries join it would mean that around 70% of China’s emissions are covered by carbon pricing. At 7.8 Mt CO2, China’s ETS alone would cover for ~22% of global emissions (see A battle for global carbon pricing supremacy is brewing: Why you need to pay more attention to China's carbon market).


