


The Kaya identity

Welcome to Carbon Risk — helping investors navigate 'The Currency of Decarbonisation'! 🏭
If you haven’t already subscribed please click on the link below, or try a 7-day free trial giving you full access. By subscribing you’ll join more than 5,000 people who already read Carbon Risk. Check out the Carbon Risk backstory and find out what other subscribers are saying.
You can also follow on LinkedIn, Bluesky, and Notes. The Carbon Risk referral program means you get rewarded for sharing the articles. Once you’ve read this article be sure to check out the table of contents [Start here].
Thanks for reading Carbon Risk and sharing my work! 🔥
Estimated reading time ~ 9 mins
The Kaya identity suggests that we have four levers - and only four levers - to influence CO2 emissions.
The formula below was developed by Yoichi Kaya, a Japanese energy economist. He argued that emissions are the product of population, GDP per head, energy intensity (energy per unit of GDP), and carbon intensity (carbon emissions per unit of energy).

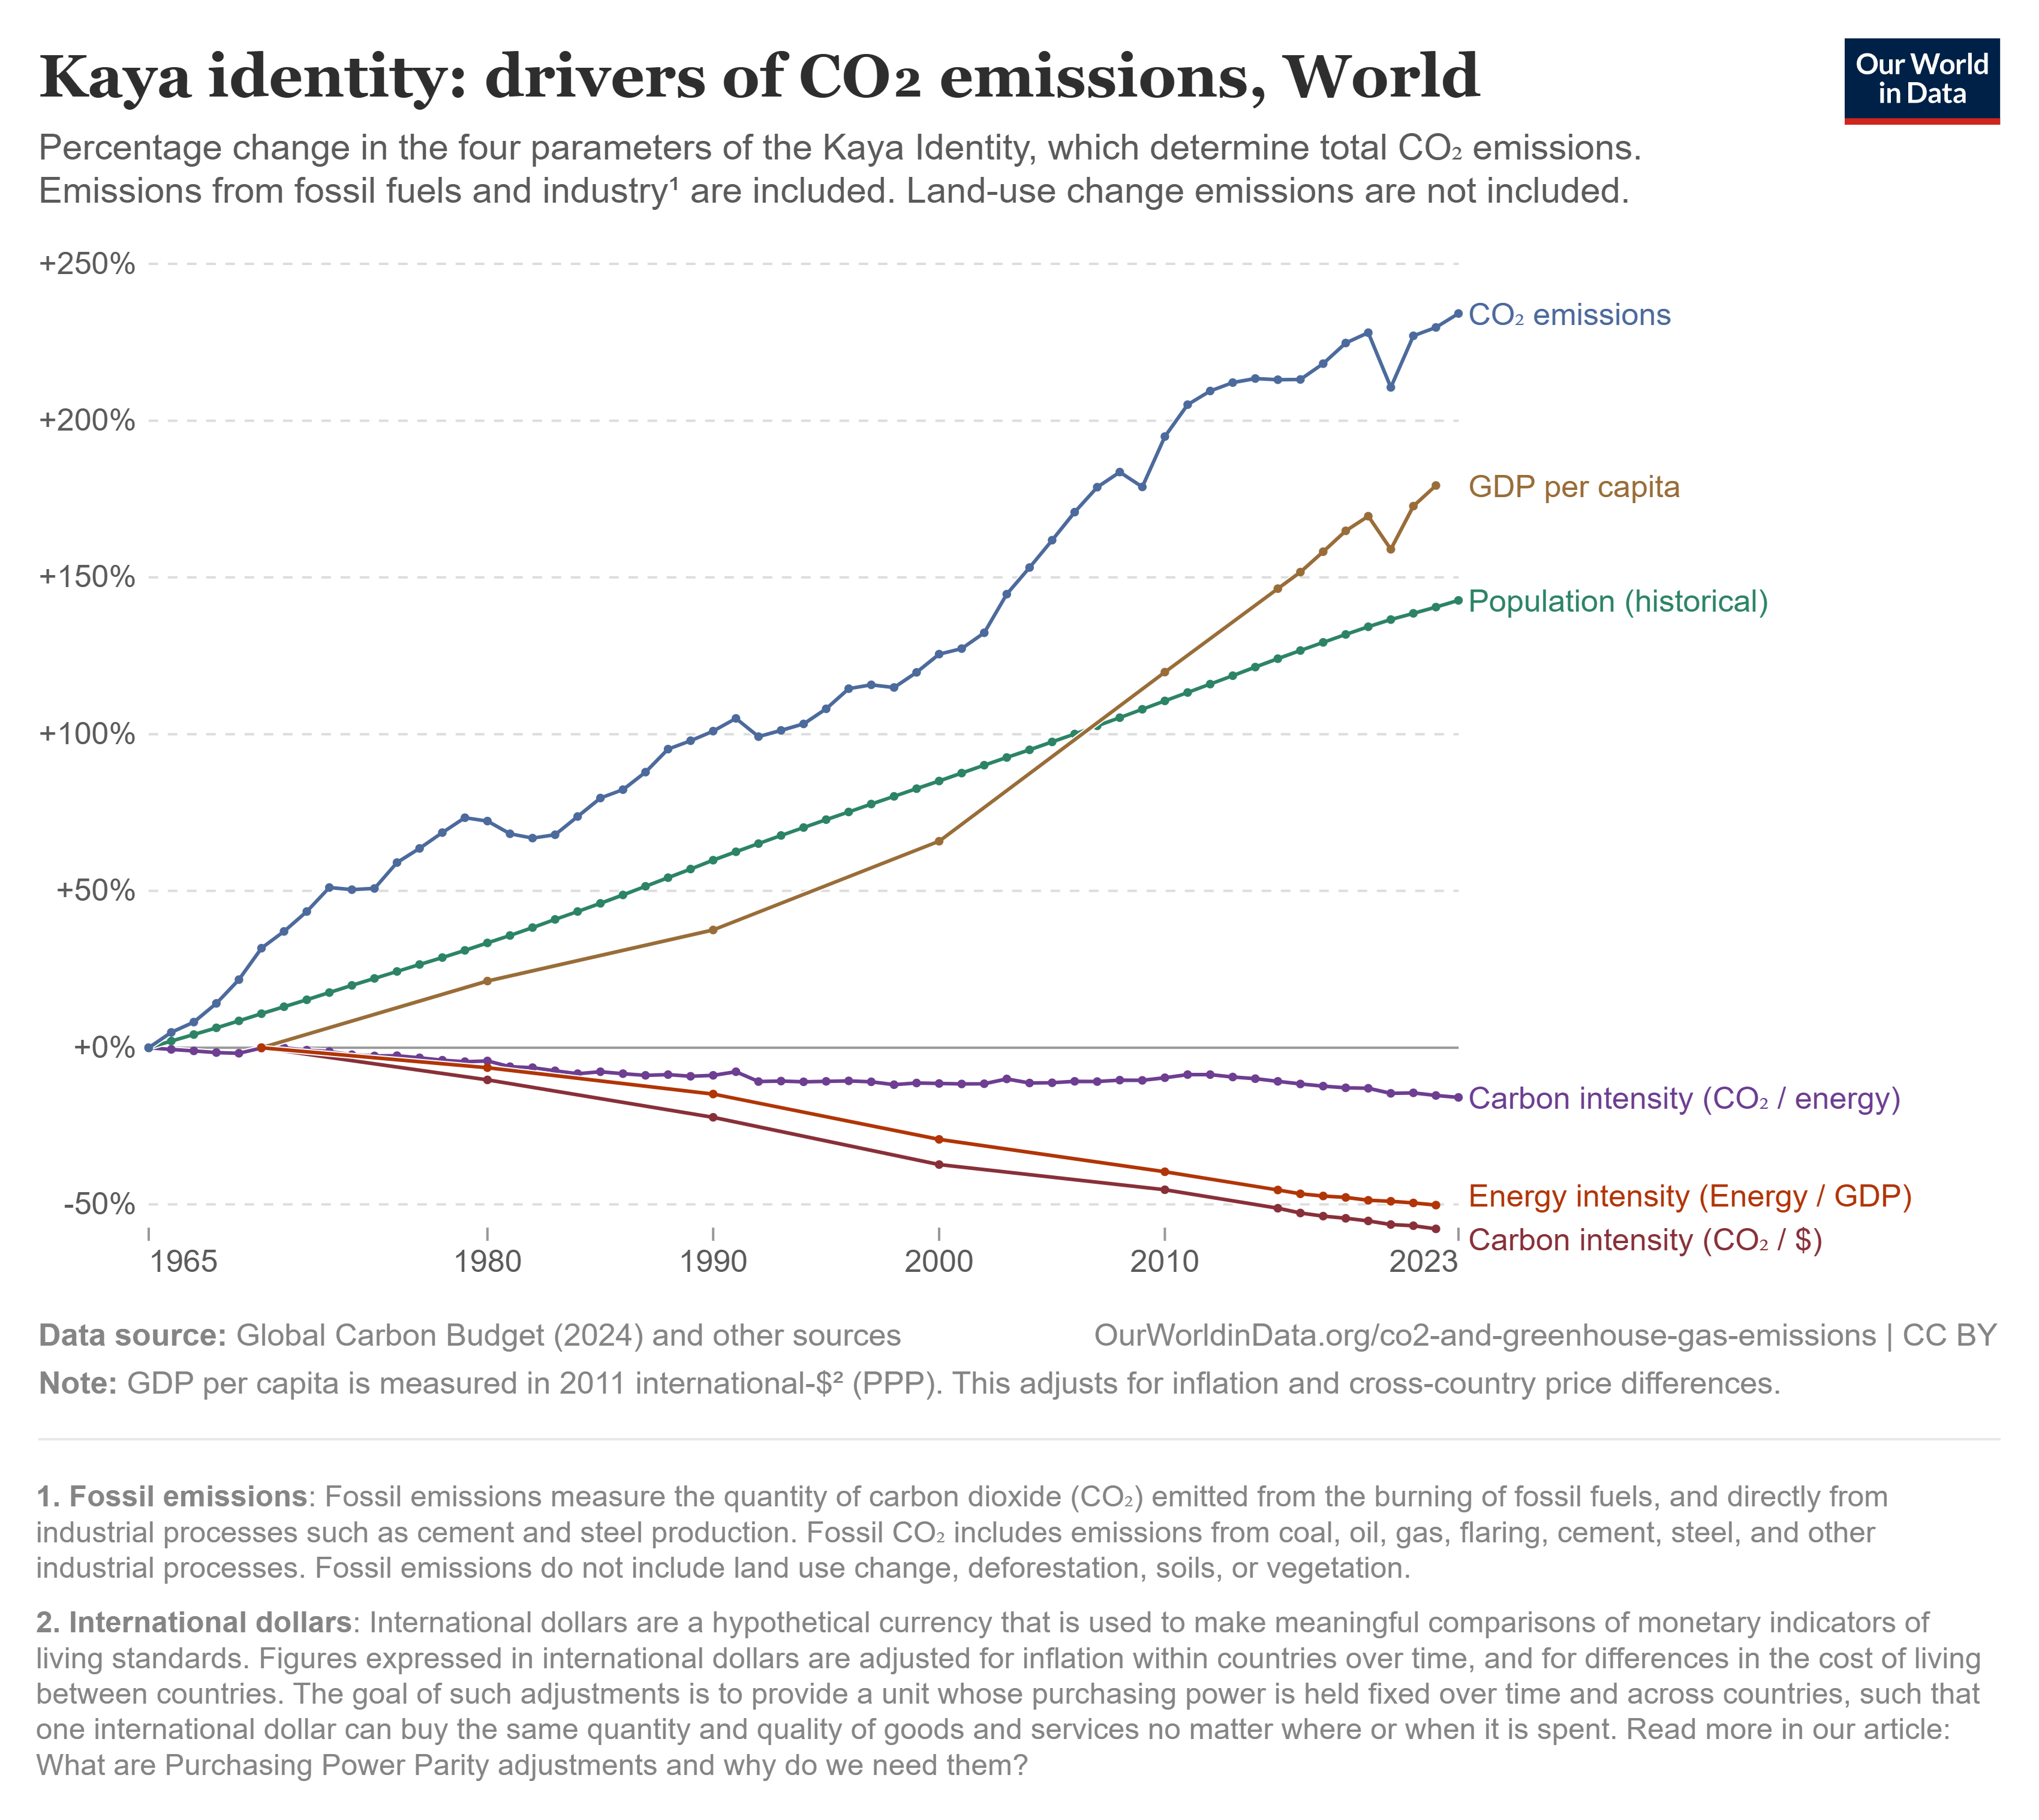
The chart below from Our World in Data shows what the Kaya identity looks like in practice, drawing on data looking back over the past 60 years. Between 1965 and 2022 the global population ⬆️140%, GDP per capita ⬆️179%, energy intensity ⬇️50%, and carbon intensity ⬇️15%. The net result is that global CO2 emissions from fossil fuels and industry ⬆️230%. Individual countries are of course at different stages of development and show vastly different trajectories for each of the four levers. If you click on the link in the footnote you can check out the Kaya identity for your country or any region in the world.1
Is it realistic that we can simply tweak one or more of the factors in the Kaia identity and put the Earth on a sustainable path? Let’s take a look at each of the factors in turn and see what the options are.
Population
We’ll start with population growth, a topic that has long drawn the ire of those predicting impending catastrophe.
In the late 18th Century one academic in particular warned of impending doom. Thomas Robert Malthus, a British cleric and scholar, remarked that with population rising exponentially, and agricultural output only increase arithmetically, misery was the inevitable result.
Malthus suggested that “positive checks” (famine, disease and war) were necessary to bring the number of people back in line with the capacity to feed them. A few years later Malthus softened his message, perhaps stung by the lack of enthusiasm, and introduced the idea of a “preventive check”, operating through the birth rather than the death rate. Needless to say that this idea wasn’t very popular either.
More recently fears resurfaced in the late 1960’s and into the 1970’s. Paul Ehrlich, ecologist, doomsayer and author of the 1968 book “The Population Bomb”, believed that overpopulation would cause disaster and widespread scarcity. In a similar vein to Malthus, the 1972 book “The Limits to Growth”, argued that if the world’s consumption patterns and population growth continued at the high rates observed at the time then the Earth would hit its limit within a century.
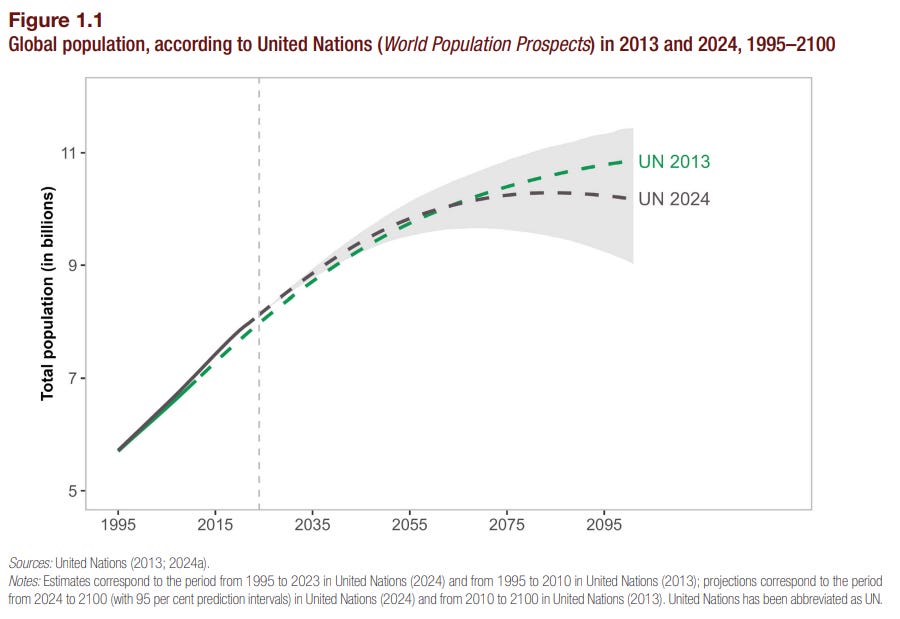
The worlds population is projected to continue to grow over the next 60 years according to the UN, from 8.2 billion people in 2024 to around 10.3 billion people in the mid-2080’s. The UN believe that the global population will drop slightly to 10.2 billion by the year 2100, 0.7 billion less than what was projected a decade ago. The reason for the downgrade is partly due to the trend towards lower levels of fertility in countries such as China, South Korea, Spain and Italy.
Apart from tinkering around the edges (e.g., family planning and incentives), there is very little governments can do to directly influence population growth. Besides, the global fertility rate has already been slowing dramatically over the past few decades. It now stands at 2.25 births per woman, down from 3.31 in 1990. Meanwhile, more than half of all countries have a fertility rate below the 2.1 replacement level.2
The phrase “Demography is destiny” is commonly attributed to the French philosopher Auguste Comte. He argued that the size and composition of a country’s population will ultimately determine its future. Population is the single most important factor in the Kaia identity, and it’s arguably the one where we have the most insight into its future development.
Economy
GDP per capita is a function of the size of the economy divided by the population. Although the media tend to focus on the overall growth in the economy, GDP per capita more closely aligns with how individuals appreciate any improvement (or worsening) in their standard of living. The average annual growth in global GDP per capita between 1961 and 2023 was 1.9%.
The average masks wide variations between countries at different stages of economic development. Advanced economies have experienced a slowdown in growth of GDP per capita over the past few decades. A phenomenon commonly referred to as secular stagnation. A function of the 3 D’s: debt, demography, and deflation. Emerging economies tend to have more opportunity for growth than advanced nations, but if their population is also growing fast, then GDP per capita will fail to grow.

The ‘de-growth’ movement suggests that we should simply focus on slowing or even contract the economy if we are to cut CO2 emissions and stop the other environmental impacts associated with growth. The book Growth: A Reckoning, by Daniel Susskind dispels this narrative pointing to a misunderstanding about the real driver behind economic growth:
“Economic growth is not driven by using more and more resources, as many tend to assume, but by discovering better and better ways to use finite resources available to us. And the universe of those intangible ideas is unimaginably vast - for all practical purposes, as good as infinite.”
Critics argue that the green growth is impossible. They point to empirical analysis which shows that the economy has never grown while at the same time reducing environmental damage. But as Daniel Susskind points out in his book, just because it hasn’t been a policy priority in the past, doesn’t mean that it can’t be in the future. It’s really up to us to determine what we want out of economic growth, not simply growth for the sake of it.
Even if an advanced economy or group of similar nations agreed to implement a policy that slows or indeed halts economic growth, it’s impossible to strongarm less developed countries into pursuing the same policy objective. Ensuring that all nations face the same incentives, and can help develop (and benefit from) the latest technologies, is the surest way to make progress.
Energy efficiency
We don’t demand energy for its own sake, but for what it enables us to do. If energy is life, then we should be careful how we use it. Energy efficiency simply means using less energy to perform the same activity, eliminating waste. The “invisible fuel” as energy efficiency is sometimes known as, provides some of the quickest and most cost-effective options to reduce energy consumption and cut carbon emissions.
Critics have argued that energy efficiency is pointless as it reduces the effective price of energy, causing consumers to use more of it, what’s known as the rebound effect. Another variation of this is where energy efficiency allows firms to reconfigure their operations, enabling them to use more energy profitably. The original theory was put forward by William Stanley Jevons in 1865 who argued that “It is wholly a confusion of ideas to suppose that the economical use of fuel is equivalent to a diminished consumption. The very contrary is the truth.”
Research does support the theory that energy efficiency does result in a rebound effect, but not one so large that it leads to the backfire effect, i.e. the energy savings are more than wiped out. Most studies suggest direct rebound effects erode 10-30% of projected energy savings, while the macroeconomic rebound effect is estimated to be in the 30-50% range, both on the national and global scale.
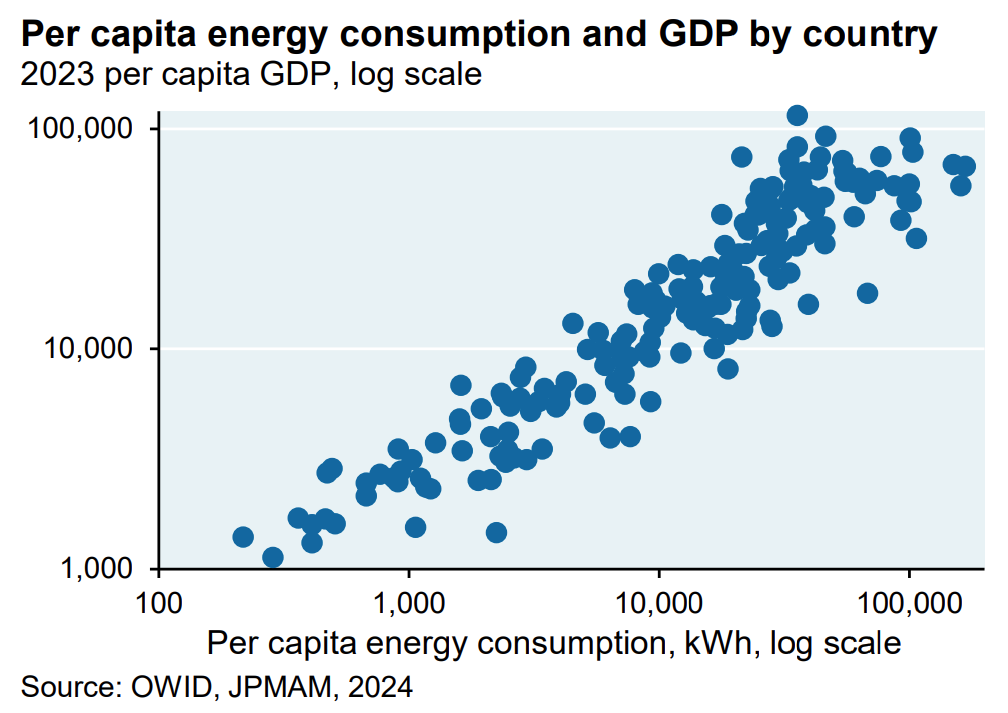
It’s important to note that energy efficiency is an enabler of economic growth. Energy efficiency leads to lower energy prices improving the availability of energy. This then leads to new products and services being developed, which in turn results in greater demand for energy. As Michael Cembalest of JP Morgan reminds us in a recent piece on the state of the energy transition, “prosperity itself is energy-intensive: among the tightest relationships in economics is the connection between a country’s per capita GDP and its per capita energy consumption.”3
How are we doing when it comes to energy efficiency on a global basis? The annual average improvement in global energy intensity - the amount of primary energy used to produce a given amount of GDP - more than doubled between the period 2001-10 and 2011-20 to ~2%, according to estimates from the International Energy Agency (IEA). Despite the incentive of high energy prices the annual average improvement has slowed during 2021-24 to ~1.3%.4
However, to be consistent with the IEA’s Net Zero Emissions by 2050 Scenario, the annual improvement in energy intensity will need to accelerate to almost 4% across the period 2022-30. The IEA calculates that global annual investment in energy efficiency will need to rise from $0.7 trillion today to $1.9 trillion by 2030.

Carbon intensity
Improvements in carbon intensity predate concerns about climate change and the role of greenhouse gases (GHG) such as carbon dioxide. Analysis of 200 years of global emissions and GDP data reveals that global carbon intensity follows a bell-curve (indicated by the dashed line). Global carbon intensity peaked around 1920 and has gradually dropped to levels consistent with that last seen in the early Industrial Revolution (see Carbon intensity: The key to an economically sustainable green transition).
Advanced economies (such as the US, Japan, and Germany) saw their carbon intensity peak in the 1910’s, while it wasn’t until the 1980’s that large emerging economies (including China, India, and Russia) witnessed peak carbon intensity. Different parts of the world are of course at different stages of development, yet the evidence indicates that carbon intensity in both advanced and emerging economies does typically follow a similar bell-curve formation.4

Governments have typically put all their eggs into reducing the carbon intensity of the economy. In the main this has involved policies that aim to cut emissions from power generation (e.g., subsidising renewable energy, phasing-out thermal coal-fired generation), but also curbing emissions from industrial production (e.g., emission mandates, incentives to invest in low-carbon technology).
State support has been crucial at the early stage of development for many low carbon technologies. As the cost of solar, other renewable energy and batteries inexorably declines, the share of zero-carbon energy generation will continue to rise. In turn traditional hard-to-abate industries will be able to leverage cheap zero-carbon power and electrification to accelerate their own decarbonisation.
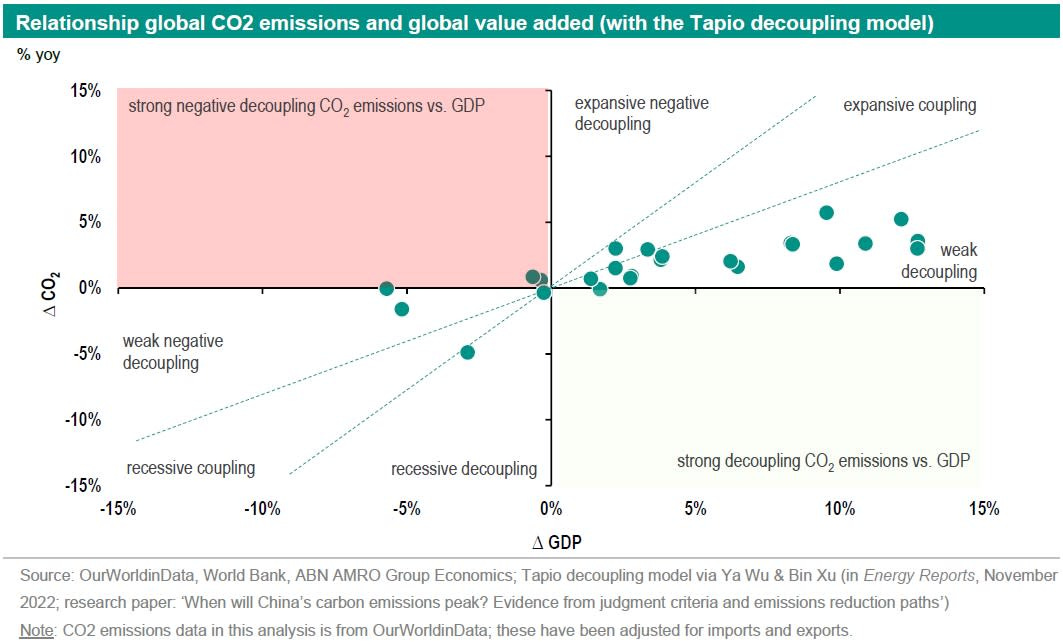
The diagram below shows relationship between global GDP growth and the trend in CO2 emissions for the period 1995-2021. From a global perspective, a weak decoupling of GDP growth and growth in CO2 emissions is apparent in the data. Global GDP growth is accompanied by an increase in CO2 emissions, but GDP growth still exceeds CO2 emissions growth. At least on a global basis that is. Many countries in Europe including the UK, France, and Germany, as well as the United States have succeeded in decoupling GDP growth from CO2 emissions outright.
👋 If you have your own newsletter on Substack and enjoy my writing, please consider recommending Carbon Risk to help grow this amazing community of readers! Thank You!👍
https://ourworldindata.org/grapher/kaya-identity-co2?time=1979..latest
https://www.un.org/en/UN-projects-world-population-to-peak-within-this-century
https://am.jpmorgan.com/us/en/asset-management/institutional/insights/market-insights/eye-on-the-market/energy-paper-2025/
https://www.iea.org/reports/energy-efficiency-2024