In a little under 50 weeks time we’ll know the identify of the next US president.
Leading in five critical swing states and with a four-point lead in national polling versus Biden, Donald Trump is the current favourite. Betting markets give the Republican’s an implied probability of 51.8% of being the winning party, while Trump has a 38.2% chance of being elected as president.1
The increased likelihood of a second Trump presidency could have big implications for climate tech investment and the speed at which US emissions fall, especially if his administration follows the pattern from his previous time in office. Over the course of his four year presidency the Trump administration is estimated to have rolled back more than 100 environmental policies. For example, replacing Obama's Clean Power Plan (which would have limited carbon emissions from fossil-fuel fired power plants), with the much weaker Affordable Clean Energy rule, and the decision to revoke California’s right to set its own emission standards. Most notably though, shortly after taking office, Trump announced that the US would withdraw from the 2015 Paris Agreement. It took three years to actually leave, but in doing so, the US became the first nation to formally withdraw from the climate accord (one of the first actions of the Biden administration was to re-join).2
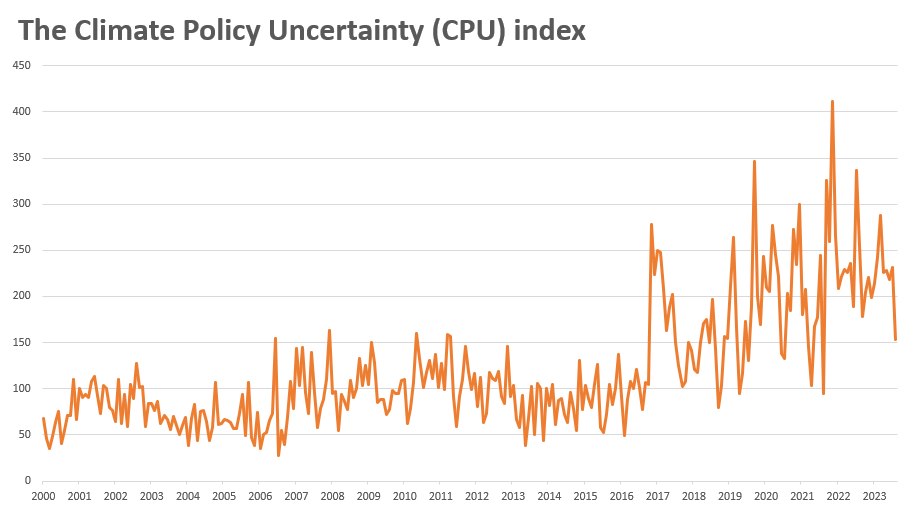
One of the best ways to gauge climate policy uncertainty is by analysing how it is reflected in the press. The media is both a mirror on the zeitgeist, and also a chief protagonist in its development. To do that we turn to the Climate Policy Uncertainty (CPU) index, constructed by Konstantinos Gavriilidis from the University of Stirling. Based on the same methodology used by Scott R. Baker et al. to produce the Economic Policy Uncertainty index, the CPU index measures the frequency of specific climate policy related words (e.g. uncertainty, climate, emissions, regulation, policy, plus several others), published in eight US newspapers, including the New York Times and the Wall Street Journal. The averaged series are normalised to have a mean value of 100 from April 1987 to August 2023 (the latest date available).3
The three environmental policy roll-backs by Trump can be seen as spikes in the CPU index chart below. However, the biggest spike in uncertainty during the Trump presidency occurred when car manufacturer VW pleaded guilty to the US Environmental Protection Agency (EPA) for fixing diesel emissions tests, followed shortly after by Trump approving the controversial Keystone XL pipeline that would have enabled oil to be transported from the oil sands of Alberta, Canada all the way to Nebraska.


