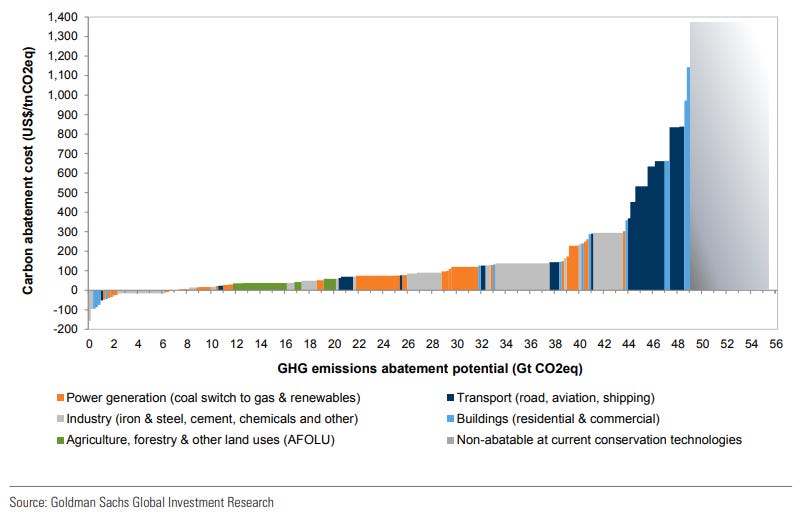
It’s not uncommon for institutions to throw around huge trillion dollar numbers when talking about the cost of meeting net zero. By itself any number is meaningless, and either generates derision or hopelessness, or both. Far better to break down the cost by technology, understand what factors influence the relative cost, and be able to show what the recent trends are.
To that end the Goldman Sachs (GS) Carbonomics cost curve of decarbonisation is the banks estimate of the global marginal abatement cost (MAC) curve. Sloping upwards from left to right, the MAC curve gradually steepens as additional tonnes of carbon emissions get increasingly more difficult, and hence more costly, to abate. The marginal carbon abatement cost, i.e., the cost of abating the last tonne of emissions required to meet a target, is one way that investors can get a fix on where carbon prices need to be in the future.
The Carbonomics cost curve of decarbonisation takes account of the cost of technologies available at commercial scale, and assumes economies of scale for those currently in the pilot phase. The cost curve is applied globally, across power generation, industry, transport, buildings and agriculture.1
GS have updated their estimates each year since 2019, taking account of changes in the cost of carbon abatement technologies and the relative cost of energy. The 2023 edition of the Carbonomics cost curve, published by the bank in late November, is shown below in Chart 1.
Chart 1: Carbonomics cost curve of decarbonisation, 2023
Chart 2 shows the evolution of the Carbonomics cost curve since the first edition in 2019. Note that the steepening in the curve now occurs at much higher levels of carbon abatement. This reflects the fact that global emissions have continued to increase since 2019, but also because innovation means that a higher proportion of the cost curve can potentially be abated (at the right price) using existing conservation technologies.
Chart 2: Evolution of the Carbonomics cost curve, 2019-23
Twelve months ago GS identified that the lower end of the cost curve was declining, whilst the extreme higher end of the cost curve had moved higher. Technologies focused on energy efficiency had become relatively more competitive as high energy prices meant a decline in the implied carbon abatement cost. Meanwhile, conservation technologies involving substituting for oil moved higher on the cost curve due to escalating transport climate tech cost inflation (see Carbonomics returns: The past, present and future cost of decarbonisation).
However, developments in the Carbonomics cost curve over the past twelve months represent a reversal in the preceding trend (Chart 3). There has been a divergence. The lower end of the curve has risen up as the cost of renewable energy has increased, while the higher end of the curve has declined as transport climate tech costs have declined.


