Welcome to Carbon Risk — helping investors navigate 'The Currency of Decarbonisation'! 🏭
If you haven’t already subscribed please click on the link below, or try a 7-day free trial giving you full access. By subscribing you’ll join more than 4,000 people who already read Carbon Risk. Check out what other subscribers are saying.
You can also follow my posts on LinkedIn. The Carbon Risk referral program means you get rewarded for sharing the articles. Once you’ve read this article be sure to check out the table of contents [Start here].
Thanks for reading Carbon Risk and sharing my work! 🔥
Estimated reading time ~ 4 mins

The forward curve for oil, natural gas, or other commodities is frequently referenced in the media, by investment funds, and by other commentators as “the markets view” of what the future holds.
It’s very tempting to view the forward curve as a price forecast, but it couldn’t be further from the truth. The forward curve shows the price at which it is possible to buy or sell contracts for a date in the future at a price agreed on today. It is not a forecast of future spot prices.
There are several factors that affect the forward curve. First, the physical characteristic of the commodity – whether it is easy to store and whether there are ample inventories, etc. Second, longer dated contracts are often illiquid, raising doubts of whether they are an effective aggregator of information. Third, the forward curve fails to account for real interest rates, i.e. taking account of inflation. Finally, the forward price will always be discounted to the market’s expected future spot price in order to give speculators a “risk premium” to take on the risk associated with hedging.
In the EU emissions trading scheme (ETS), the right to emit one tonne of carbon can be bought or sold for immediate delivery (i.e., the spot market via the regular daily auctions) or for future delivery; next quarter, end of the year, or in the quarters thereafter. The chained prices of sequential EUA futures contracts form a curve known as the EAU forward curve.
In contrast to physical commodities, EUA storage costs are negligible. As of 2022, the German Emissions Trading Authority (DEHST) charged €393 to open an account and €649 as an account administration fee for the trading period 2021-2030. Transport costs are also negligible, a mere entry in an account. Physical EUAs can be banked for future compliance needs, creating a strong link between the spot price and the futures price. Finally, EUAs can only be used by the purchaser for compliance purposes so don’t face a security risk, which means there are no insurance costs to contend with.
The EUA futures market has, except for a brief period after it launched in 2005, consistently been in contango. A forward curve is described as “in contango” when it is upward sloping and so prices in six months’ time are higher than the spot price. In the case of physical commodities, traders are typically willing to pay a premium to avoid the costs associated with transporting, storing and insuring it, and therefore the furthest-out contracts are typically higher in price.
In the case of the EUA, the contango should equal the cost of borrowing since the storage, transport and insurance costs are nil or negligible. It means that the higher the interest rate the steeper the EUA forward curve, since the opportunity cost of holding physical EUAs also rises. At the time of writing the Dec-24 EUA contract is trading at €65.70, while the Dec-25 contract is trading €2 higher at €67.70 - a negative roll yield of ~3%. If the contango is higher than this then buyers would be incentivised to buy physical and sell forward, moving the market to a position where no arbitrage exists.
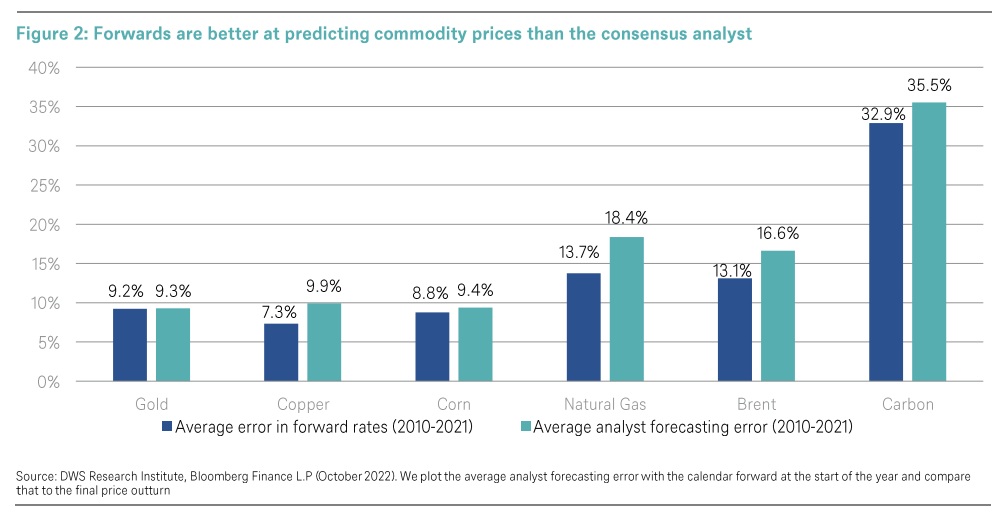
Asset management firm DWS compared the benchmark December EUA contract at the start of the year with the outturn at the end of year based on the period 2010-2021. Overall, the EUA forward curve had an average error of 32.9%. They also analysed the performance of analyst forecasts made at the start of each calendar year. DWS found that carbon price predictions had an average absolute error rate of 35.5%. The forward curve is - on average - a better predictor across all commodity markets (just), but hardly evidence of a seer.
Beware false prophets!
👋 If you have your own newsletter on Substack and enjoy my writing, please consider recommending Carbon Risk to help grow this amazing community of readers! Thank You!👍


