Last week the European Securities and Markets Authority (ESMA) published their preliminary report on the functioning of the EU carbon market. The report was requested by the European Commission in light of high energy prices in Europe, and subsequent questions that had emerged as to the functioning of its carbon market. Specifically, ESMA was tasked with examining carbon trading behaviour and whether the market needed to be reformed in some way to help respond to the energy crisis.
In short their conclusion is that EU ETS participant activity has not “significantly changed since 2018 and is broadly in line with the expected functioning of the market, where non-financial entities buy EUA futures to hedge their carbon price exposure, while financial counterparties act as intermediaries to facilitate trading and provide liquidity to the market"
So far so good. However, the report caught my eye because of the in-depth analysis it provides on the EU carbon market over the past four years, including major market events, the evolution of the carbon futures spread, and carbon price volatility and correlation with other asset markets.
First up, the chart below highlights the major political and economic events that have driven EU carbon prices over the past four years.
The initial market event was the approval of ETS reform in early 2018. Carbon prices increased in anticipation of these reforms, but their formal sign-off was the initial political event that sparked the rally from earlier sub €10 per tonne levels. These reforms introduced a 2.2% reduction on the cap on the total volume of emissions, as well as a temporary doubling of the number of allowances to be placed in the MSR until the end of 2023.
In late 2019 the presentation of the European Green Deal passed without much of a murmur in the market. But right around the corner was Covid-19. EU carbon prices plunged from around €24 per tonne at the beginning of March 2020 to less than €15 per tonne on the 23rd March, a decline of around 38%.
The selling not surprising in a panic when correlations tend to move to 1. Carbon prices got off lightly compared with Brent crude oil which experienced a decline of two-thirds over the same time period. Carbon rebounded to its early March levels by the end of June. It wasn’t until early 2021 that Brent crude prices achieved the same feat.
The publication of the EU recovery package in July 2020 outlined details of how the €750bn package to reconstruct the regions pandemic hit economies would be spent. The package of measures provided confidence to the market that major energy users (and obligated buyers of emission allowances) would be supported through the worst of the crisis.
In late 2020 the market got a further boost of confidence after The European Council reached agreement on a general approach on the proposal for a European climate law. This included a new EU greenhouse gas emissions reduction target of at least 55% by 2030 compared to 1990.
Finally, carbon prices have been supported by rising gas and energy prices. The relative attractiveness of thermal coal relative to natural gas boosted demand for coal which in turn increased demand for allowances to offset the more carbon intensive fuel.
The spread between Dec-2025 and Dec-2021 futures contracts ballooned from around 5% in early 2018 to 20% in the second half of 2018 (shown in the chart below). The steep contango in the market was a significant barrier to long only investors wishing to take a long-term position in the EU carbon market. However, since then the spread has gradually narrowed and is now back to 5%, a very small negative roll yield to overcome when using carbon futures contracts.
Recent increases in spot carbon prices have led to an upward shift in the future curve, but without any meaningful steepening. According to the ECB, the main reason for this is that surplus allowances can be kept to cover future needs, while the cost of “storing” allowances is small, creating a strong link between spot and futures prices.
The third chart of interest for existing and potential future investors in the EU’s carbon market is volatility. The chart below shows the historical volatility (calculated as rolling 5-day standard deviations) of EU ETS closing daily spot prices. The number of daily price changes greater than 5% has increased from 1.4 per month before March 2020, to almost twice per month since. This makes sense given the number of major market moving events that have taken place since March 2020.
Compared with other assets however, EU carbon market volatility is broadly comparable with crude oil or coal, and significantly less volatile than natural gas.
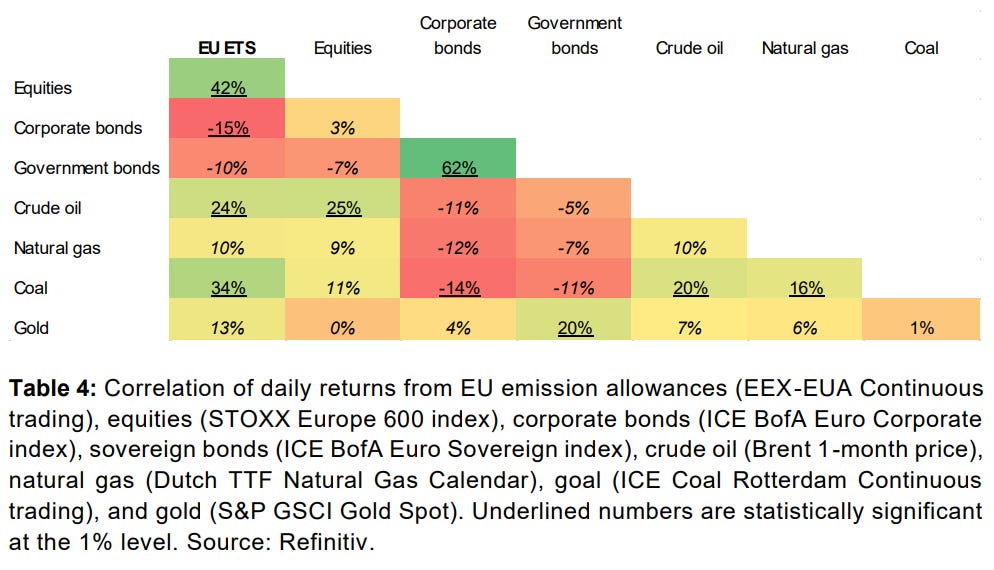
The EU carbon market is really only very loosely correlated to other asset and commodity markets. Prior to March 2020 the carbon price was most closely positively correlated to crude oil (38%), corporate bonds (33%), EU equities (32%) and coal (27%). However, since March 2020, EU equities (42%) and coal (34%) have the strongest positive correlation with EU carbon prices.
This may suggest that analysts and investors are misinterpreting short term movements in the EU carbon market, i.e. placing too much weight on the broader energy complex, and not enough weight on changes in EU equity sentiment as a driver of the EU carbon price.


