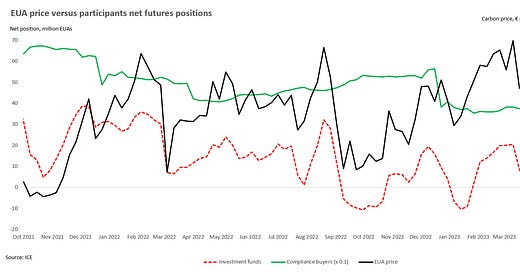
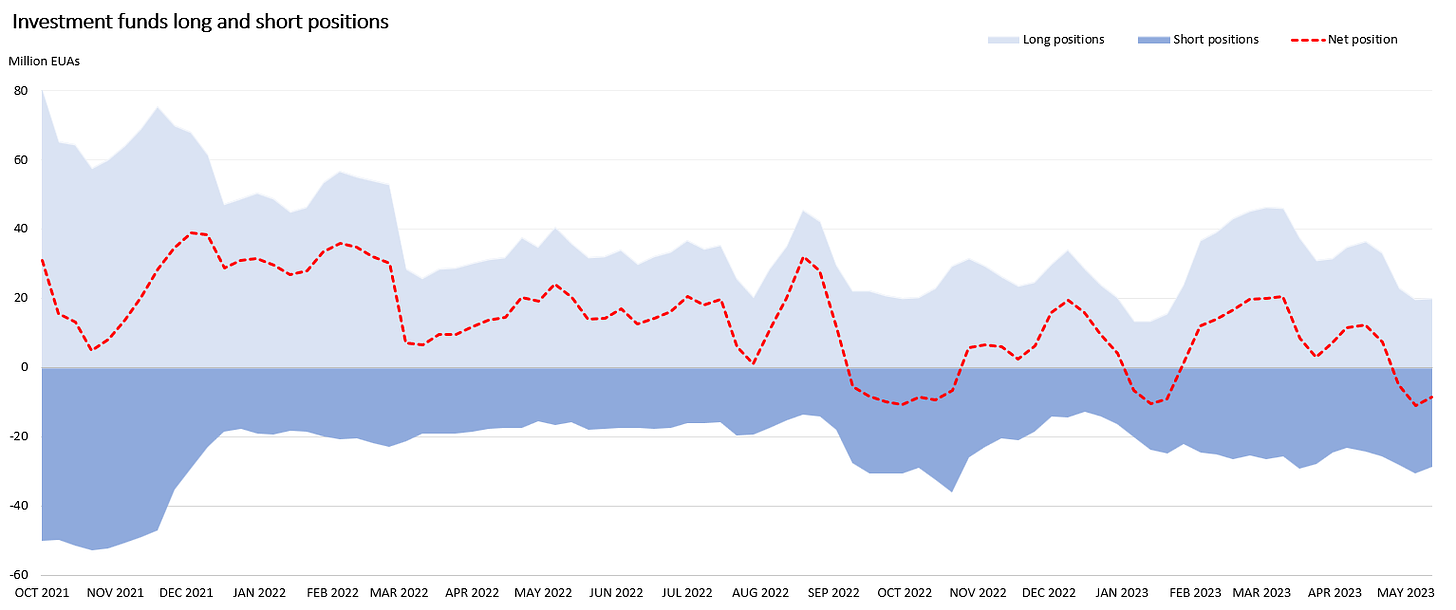
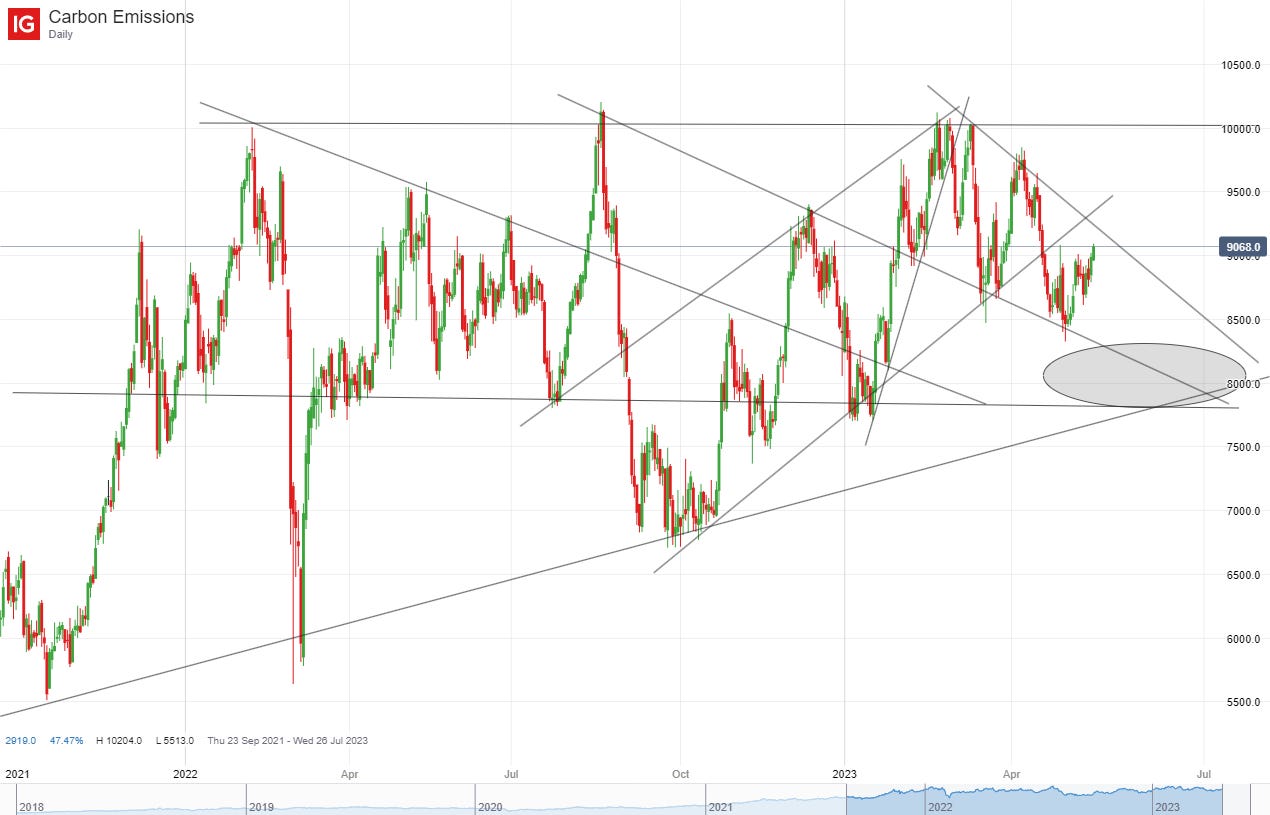
The latest Commitment of Traders (COT) report (w/e Friday 12th May) shows that investment funds had a net short position of 8.6 million EUAs, down slightly from the record short of 11 million EUAs seen one week earlier.
The decline in the net position over the past 5 weeks has continued to be due to closing out of long positions; down 13.2 million EUAs to 20 million EUAs. Short positions have remained around the 20-30 million EUA level (see Investment funds ditch carbon after failure to decisively breach €100).
Whenever the market has been this short in the past, the EUA price tends to rally strongly during subsequent weeks as funds re-establish their long positions. As the chart towards the end of this article shows, the carbon price has staged something of a rebound, up by ~€5 since the 4th May to around €90 currently (see The big short: Record net short position underlines the extreme negative sentiment towards carbon).
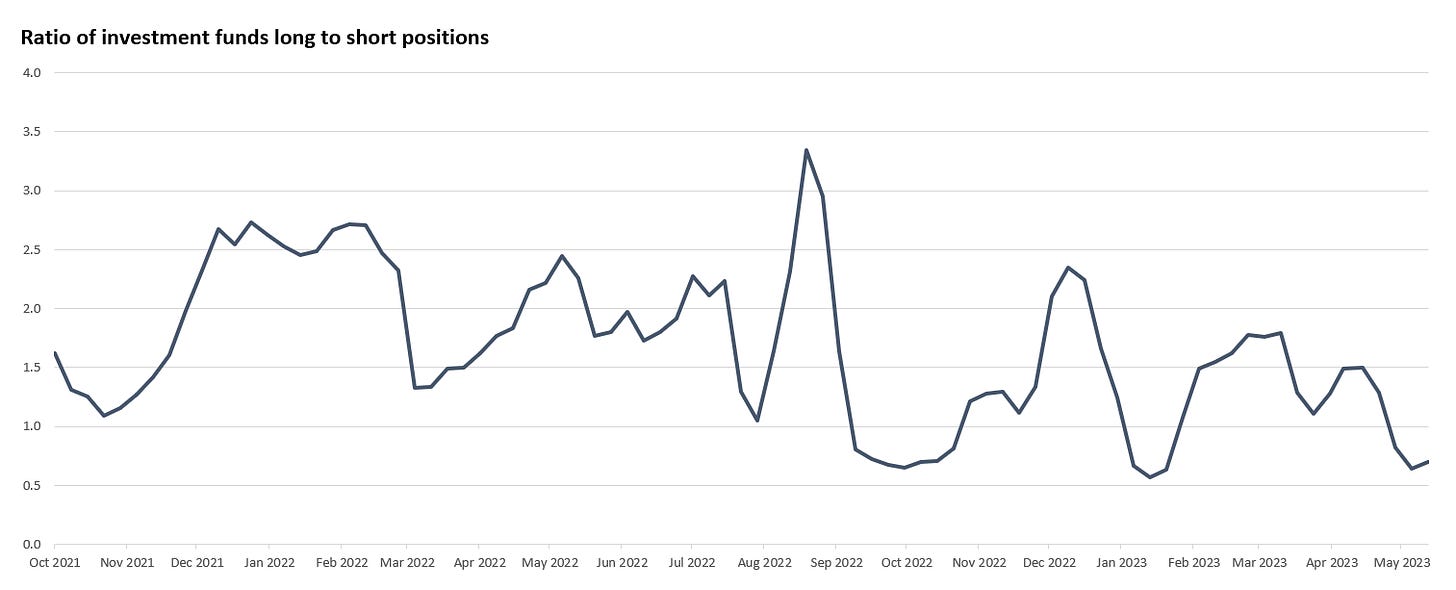
The ratio of long / short positions has also declined even further, settling down below 1. As with the first chart, the EU carbon market also tends to rally strongly when the long / short ratio drops below 1.
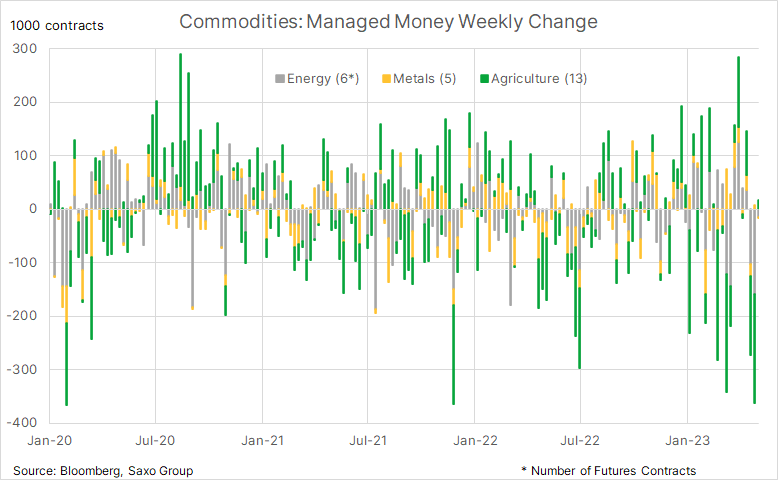
The liquidation in EUA long positions mirrors the picture in commodity markets. Over the past few weeks there has been a big scaling back in net length, especially in energy and metals markets, as fears over the strength of demand have persuaded traders to scale back their positions. In the same way that the EUA price has bounced, Brent crude is up by ~$4 per bbl over the same period to $76 per bbl.
Despite the rebound in the carbon price towards €90 there appears to be little in the way of bullish drivers for the market to move much further.
Low emissions during the first four months of the year (something that has been corroborated by recent results posted by utilities), a recovering in French nuclear output during April and into May (and an expectation of further output gains), the change in the EU ETS compliance timetable (from April 2024 to September 2024), low energy prices, coupled with weak industrial production (and a reluctance by large energy users to bring back capacity despite low prices), all appear to be pointing towards a moderation in demand for EUA’s from compliance buyers.
That combination of those factors means we could have a much more speculative driven market for the next 4-6 months, before utilities and other compliance buyers re-enter the market.
From a technical point of view my base case is that the price will gradually move down towards €80 (somewhere in or around the grey oval in the chart below), and then breakout higher from there.
EUA Commitment Of Traders (COT) data 101
Commodity futures exchanges tend to publish data on the hedging and speculative activity of participants on a weekly basis. This publication is known as the Commitment Of Traders (COT) report. The Intercontinental Continental Exchange (ICE) COT reports breaks down futures market participants into the following five categories:
IFCI: Investment firms or credit institutions
IF: Investment funds
OFI: Other financial institutions
CU: Commercial undertakings
Other: Operations with compliance obligations under directive
There are four challenges carbon investors have about using positioning analysis: the time lag between when open interest data is collected and published, how traders are classified, the challenge in disentangling the motivations of traders, and the ‘age’ of the positions.
The ICE typically publishes the COT report on the same day each week. Although there is a small lag in the positioning information, its important to remember that this data is still very much real-time compared with almost all other data that is reported in the market. Importantly, everyone in the market gets the same report, at the same time.
The second concern relates to how traders are classified. For example, simply because a CU and Other are compliance buyers does not preclude them from using commodity futures markets for speculation, in addition to hedging. Meanwhile, some of the activity in the IFCI and OFI category will also involve hedging on behalf of compliance buyers. This muddies the water to some extent in interpreting the motivations of the various participants in the market.
The third challenge that investors raise about positioning data supplied by the COT report is closely related to the second concern above. How to disentangle the motivations of traders? For example, IF’s are a broad church and include macro funds trading equities, a commodity fund speculating on the shape of the futures curve, an index or ETF management firm. This can mean that positions are placed that do not solely reflect participants view on the price direction of carbon.
The ‘age’ of the positions is also a concern. For example, long-term investment positions - for example, positions that underpin carbon ETFs and long-term hedging positions - can make certain positioning profiles difficult to interpret.
Investment fund (IF) behaviour
The most closely watched category of trader is IF - investment funds - which encompasses hedge funds and asset managers. Despite the concerns over categories expressed above, market participants must, in the main, behave according to the category that they have been assigned.
One factor here is crucial, market participants in the IF category have to close out their positions, i.e. they can’t go to delivery. If they are playing in the physical market they would have to have been assigned to a different category. And so when you see a very large short position in the IF category they are going to have to close that position out.
This can get interesting when prices are at an extreme. For example, it can often be a very interesting buying opportunity when you see that money managers have made a nice paper profit by building up a large short position, especially if prices are at the lowest level for some period of time.

